I added analytics to seven sites.
Every dashboard showed zero.
One afternoon, I had Claude wire self-hosted Umami into every site on my VPS and put the numbers on a public /analytics page. It did the whole thing in one conversation. Everything deployed clean, every page carried the snippet — and hours later I came back with a bug report: the dashboards sat at a flat zero. The tracker script returned 200. The body was valid JavaScript. The cache was clean. And it still never ran. This is the debugging story, and the ten-line fix that makes analytics survive ad blockers.
The one-sentence version
Privacy extensions don't just block tracker requests — they can let the script download and quietly stop it from executing, so the only analytics that reliably works is served first-party, from your own domain.
If your audience is technical, a third or more of them run an ad blocker. Self-hosting your analytics is not enough — a tracker loaded from analytics.your-other-domain.com is still third-party from the browser's point of view, and it dies the same way Google Analytics does.
The setup: one Umami, seven sites
My VPS hosts a handful of small apps on subdomains: a photo generator, an Apple refurb tracker, two todo apps, a podcast site. It also already ran a self-hosted Umami instance that was only tracking one external site. So the plan was simple:
- Register every site in Umami. No clicking through the UI — seven INSERTs straight into Umami's Postgres, one UUID per site.
- Drop the snippet into every <head>. One line per layout, data-website-id per site.
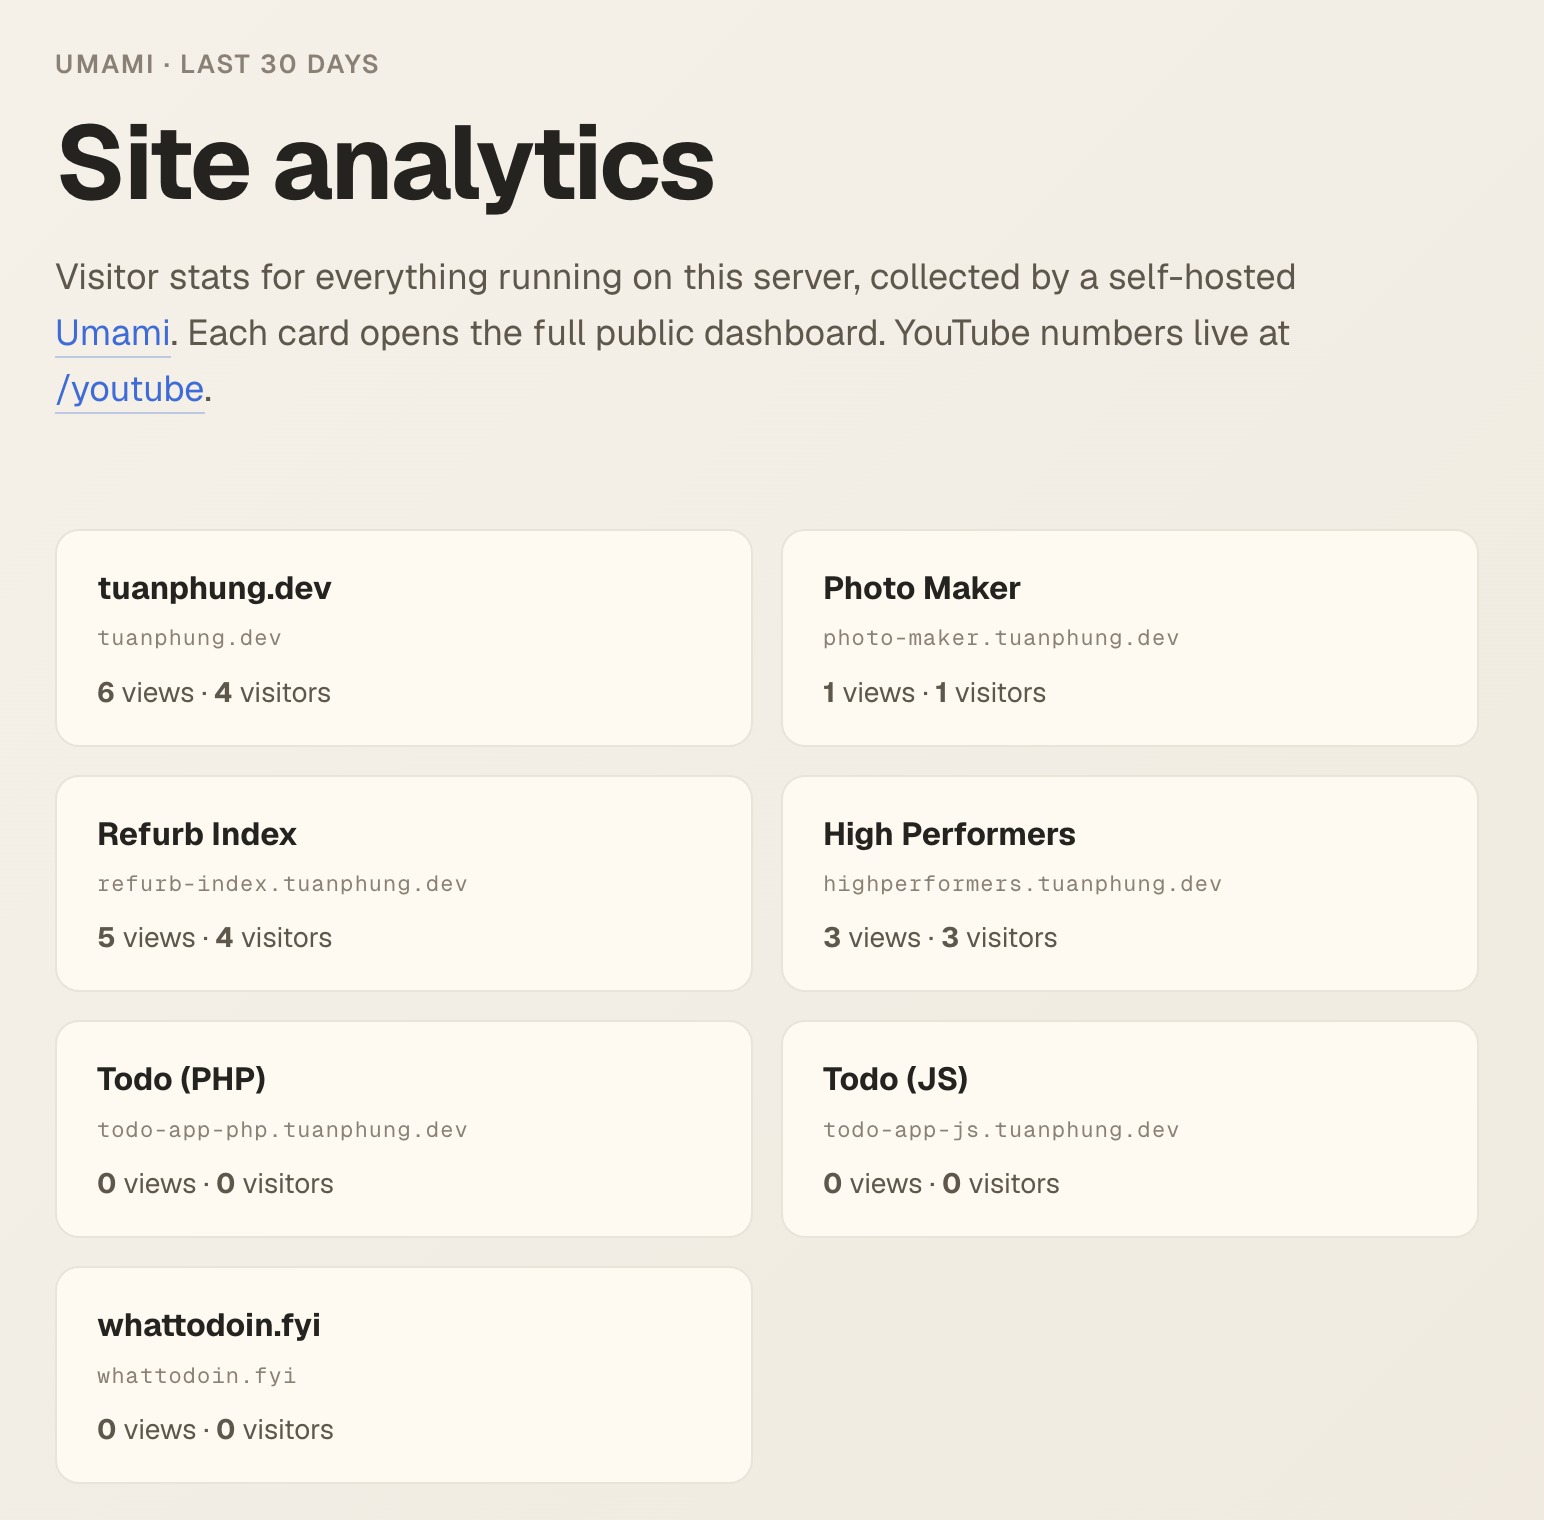
- Build a public scoreboard. A new /analytics page on the homepage that shows views + visitors per site.
The scoreboard has a neat trick: it needs no credentials. Umami lets you generate a share ID per website — a public, read-only dashboard URL. The share endpoint gives out a token, and that token is enough to query the stats API:
GET /api/share/{shareId}            → { websiteId, token }
GET /api/websites/{id}/stats?…      → { pageviews, visitors, … }
    with header  x-umami-share-token: {token}
The homepage fetches that server-side with a 10-minute file cache and renders a card per site. Anyone can click through to the full public dashboard — it's the same data the share page exposes anyway.
"It's still showing zero"
Hours after Claude deployed, I pinged it: "It's still showing zero." I had visited the sites myself, and we could verify the snippet was in the served HTML. Time to split the pipeline in two — is the problem on the server or in the browser?
Server first. Claude built an event by hand with curl, sent it to the collect endpoint, then counted rows in Postgres:
curl -X POST https://umami.example.com/api/send \
  -H 'Content-Type: application/json' \
  -d '{"type":"event","payload":{"website":"…","url":"/curl-test", …}}'

SELECT count(*) FROM website_event WHERE website_id = '…';
     1   ← lands instantly. The server is fine.
So it's the browser. Next step: open the site in a real browser and test it from the console. This is where it gets genuinely weird:
Same URL, same bytes, two different outcomes. The only difference between the dead script and the live one is who asked for it: the HTML parser loading a third-party tracker vs. page JavaScript appending a node. That is the fingerprint of a privacy extension — it recognizes the parser-initiated, cross-origin tracker request and disables it, while letting ordinary fetches through. From the page's point of view nothing failed. There is no error, no console warning, no blocked-request banner. The script just… does not run. And my own browser runs a blocker — like a big slice of any technical audience. So my visits never counted, and neither would most readers'. We had shipped trackers that my own ad blocker ate on day one.
The fix: serve the tracker first-party
Blockers watch for the cross-origin request to a known tracker path. So remove the cross-origin part: every site serves the tracker from its own domain, and the reverse proxy quietly forwards it to Umami. Caddy makes this a reusable snippet:
(umami_proxy) {
	handle /s.js {
		rewrite * /script.js
		reverse_proxy umami:3000
	}
	handle /api/send {
		reverse_proxy umami:3000
	}
}

example.tuanphung.dev {
	import umami_proxy
	handle {
		reverse_proxy example-app:8000
	}
}
And the snippet in every <head> becomes relative:
<script defer src="/s.js" data-website-id="…"></script>
Two details make this work with zero extra configuration. First, Umami's tracker derives its collect endpoint from the script's own src origin — load it from /s.js and it posts to /api/send on the same domain, which the snippet above also proxies. Second, renaming the file (script.js → s.js) drops the filename blocklists match on. To the browser, it now looks exactly like the site's own JavaScript — because it effectively is.
Claude redeployed. I opened the site in the same browser, blocker still on: window.umami is an object, and the pageview shows up in Postgres a second later. Numbers on the scoreboard at last.
Three things worth stealing
One hand-made POST to the collect endpoint told us the whole server half — proxy, app, database — was healthy. That cut the problem in half in two minutes, and the other half is where the answer lived.
A 200 response, a valid body, an empty window global, and no console error is not a bug in your code. Something between the network and the JS engine ate it. Test by injecting the same URL dynamically — if that runs, you have found your culprit.
The /analytics page authenticates with nothing — it starts from Umami's public share IDs, the same access anyone clicking the dashboard link gets. No secret to leak, no account to create, nothing to rotate.